Clustering describes the process of identifying objects that look similar – and seem to belong together – and assigning them into a common group. This is also called a cluster.
A short example
Let’s imagine you go hiking in the beautiful Swiss mountains. While on your path to the summit, you stumble over some interesting red berries that you have never seen before. Looking around, you notice multiple bushes with the same red berries. Even though they are not all perfectly identical, they are similar enough for you to assume that they are the same type of berries. Continuing on your hike, you stumble across some blackberries. While they are the same size as the red ones, they differ in shape and, more importantly, they are black. This leads you to believe that these are a different type of berry.
Without realising it, you just performed clustering. Or, in other words, you identified similar objects and assigned them into the same group or cluster: the group of red berries and the group of blackberries. By identifying these two groups, you ensure that the items in a given cluster are more similar to each other than the items of any other cluster, thus making as distinct clusters as possible.
It’s important to highlight that this clustering highly depends on the data at hand and on the purpose. For example, let’s say you also passed by some hazelnut trees and collected a lot of nuts. If somebody asked you to group these berries and nuts into two clusters, you would probably put the red and blackberries together. And if you needed to create three groups, you would choose red berries, blackberries and nuts.
Now what if you were asked to make 10 groups – would you try to consider the size or ripeness of the item as well? Depending on the number of groups required, the separation might be more or less useful and the criteria according to which you split the groups might become too detailed.
AI has the exact same issues when it tries to cluster a dataset because, usually nobody knows ahead of time which number of clusters or groups is the most useful. That’s why this approach is classed as unsupervised machine learning; we don’t have the ‘true’ label to identify what belongs where.
Machine-based clustering
In a previous article, we learned that the task of clustering belongs to the machine learning category of unsupervised learning. In unsupervised learning, we try to find useful structures in our dataset that we hope to exploit later on. However, in contrast to supervised learning, unsupervised learning doesn’t provide a target label to guide us during our approach.
While there are multiple ways to do clustering, the end goal is always the same: establish groups of data points so that the points within a group are as similar (or close) to each other as possible, while the groups themselves are as distinct (or far apart) from each other as possible.
Artificial intelligence performing clustering can be encountered in multiple settings. For example:
- Customer segmentation: Customers can be grouped together based on their purchases, their activity on a website, or their interests. This can lead to a better understanding of sub-groups and enables targeted marketing. A similar approach can also be used to group social media posts and identify ‘hot topics’ that are being discussed, or identify ‘influencers’. This can be useful to track discussions around elections, trending topics, etc.
- Recommender systems: Understanding which sub-group of consumer you belong to allows AI to recommend you products that similar consumers from your group are also interested in.
- Image clustering: Without knowing the actual content of your photos, an AI can use the information about color, time stamp, geolocation and faces to group similar photos together and package them into a folder or collage. Using that information, some smartphones even suggest nice summary videos or photo collages for you.
- Anomaly detection: Being able to group similar objects together also gives you the ability to detect when a new object doesn’t belong to any previously identified group. Such a data point can then be targeted as an outlier or an anomaly and be further investigated. This anomaly detection approach can be used to detect credit card fraud or identify abnormal sensor activities in a production line, which might highlight a manufacturing malfunction and indicate the need for machine maintenance investigation.
How humans cluster objects into groups
To better explain how clustering works and to understand how a machine learns to carry out this task, let’s first reflect on how we humans would do this. Let’s imagine we have the following dataset:

Each gray point in this plot represents an object in our dataset. As previously mentioned, points that are close to each other share characteristics, and points further away are less likely to do so. So we could group the points like this:
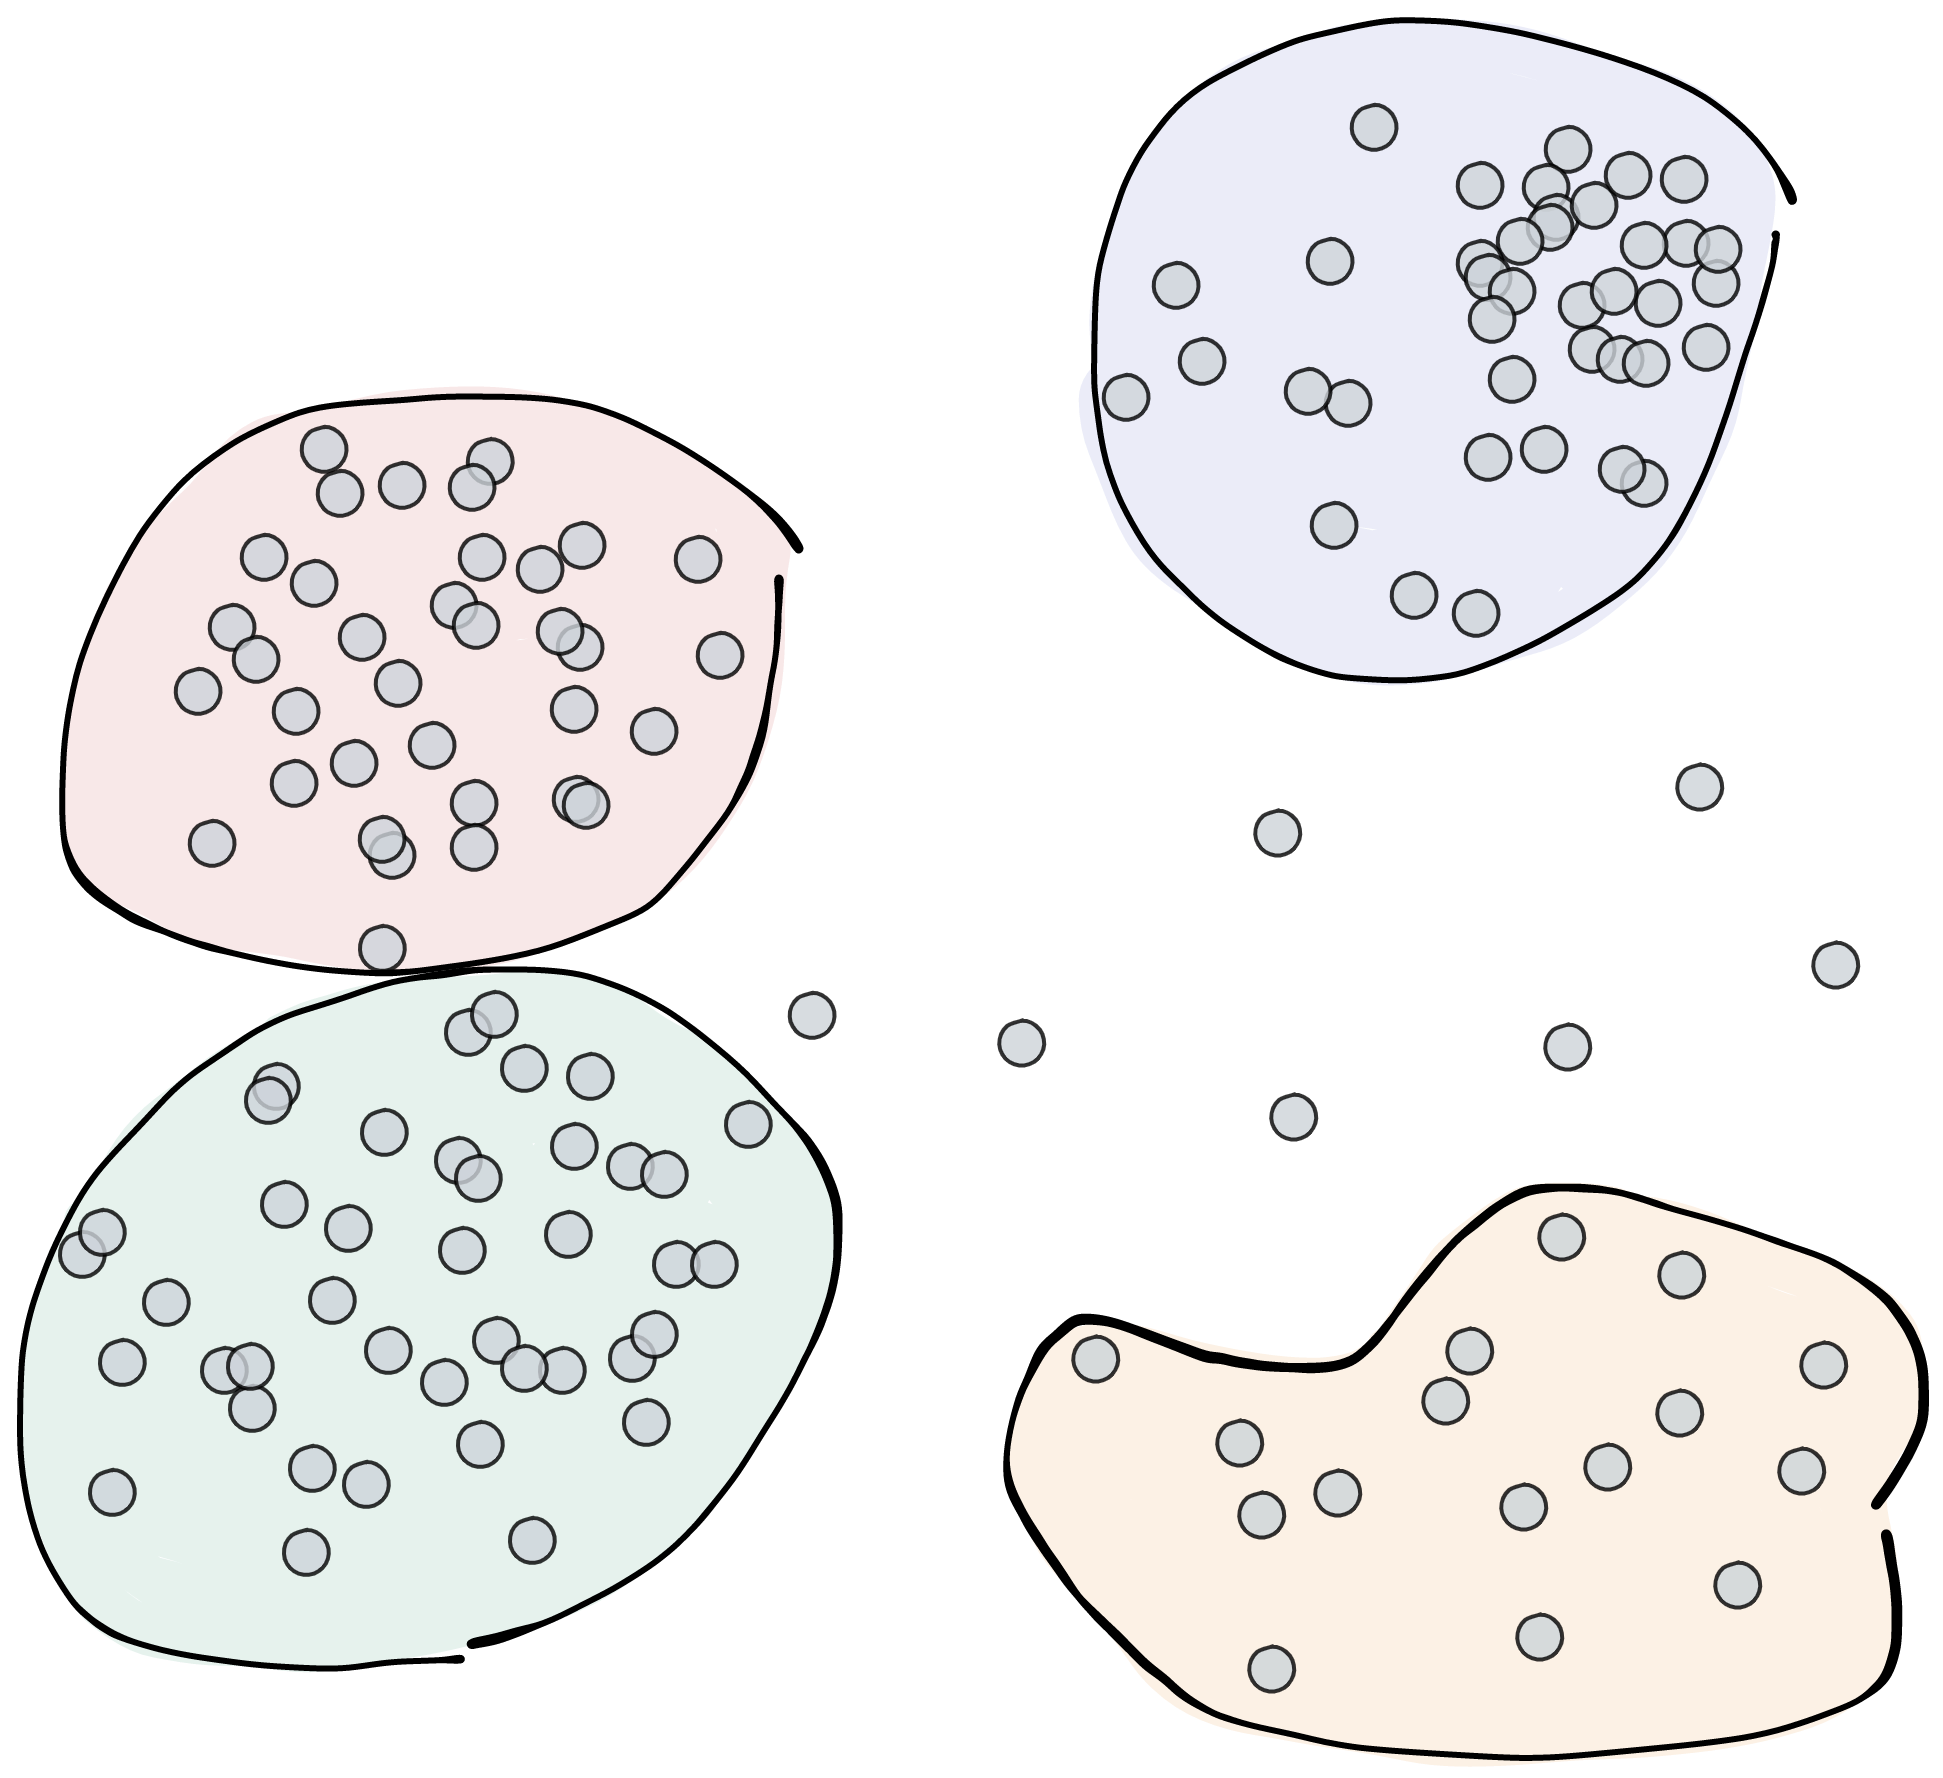
Without realising it, we’ve already made some important decisions. First, how many clusters do you want to create? In this example we stopped at four. We could have also clustered the remaining few points in a fifth cluster, or we could have combined the green and red ones and only used three. Second, we decided to leave a few points out as they don’t seem to belong to a clear group. Or in other words, we identified several outliers and anomalies.
These two points – deciding on how many clusters to use and how to handle outliers – are at the heart of AI-based clustering.
How machines learn to cluster objects into groups
Let’s now look at the same problem again and see how a machine would learn to cluster the gray points into unique groups. And to better understand the nuanced differences in how an AI could handle this task, let’s take a look at three different approaches: centroid, density and connectivity-based clustering.
The goal of this exploration is not to teach you the intricate details of these three approaches, but to show you in a hopefully intuitive way that there are many different ways a machine can go about clustering points in a dataset.
Centroid-based clustering
A straightforward way to cluster data is to use ‘centroids’. In this context, a centroid is the point in the centre of a group. Like the centre of gravity of an object, the centroid holds all points within a group together by being the point in the centre of the cluster that is the closest to all other points within it.
The only thing the AI needs to create these centroids is the data and the number of centroids it should create. Once the centroids are established, then each data point is assigned the label of closest centroid, thus creating the clusters.
The following figures show how the gray points would be clustered if we use four (left) or three (right) centroids to cluster our dataset. The centroids are the big diamond-shaped points. All points that are the closest to the yellow centroid are colored yellow and belong to the yellow cluster, and the same applies to all other colored points.
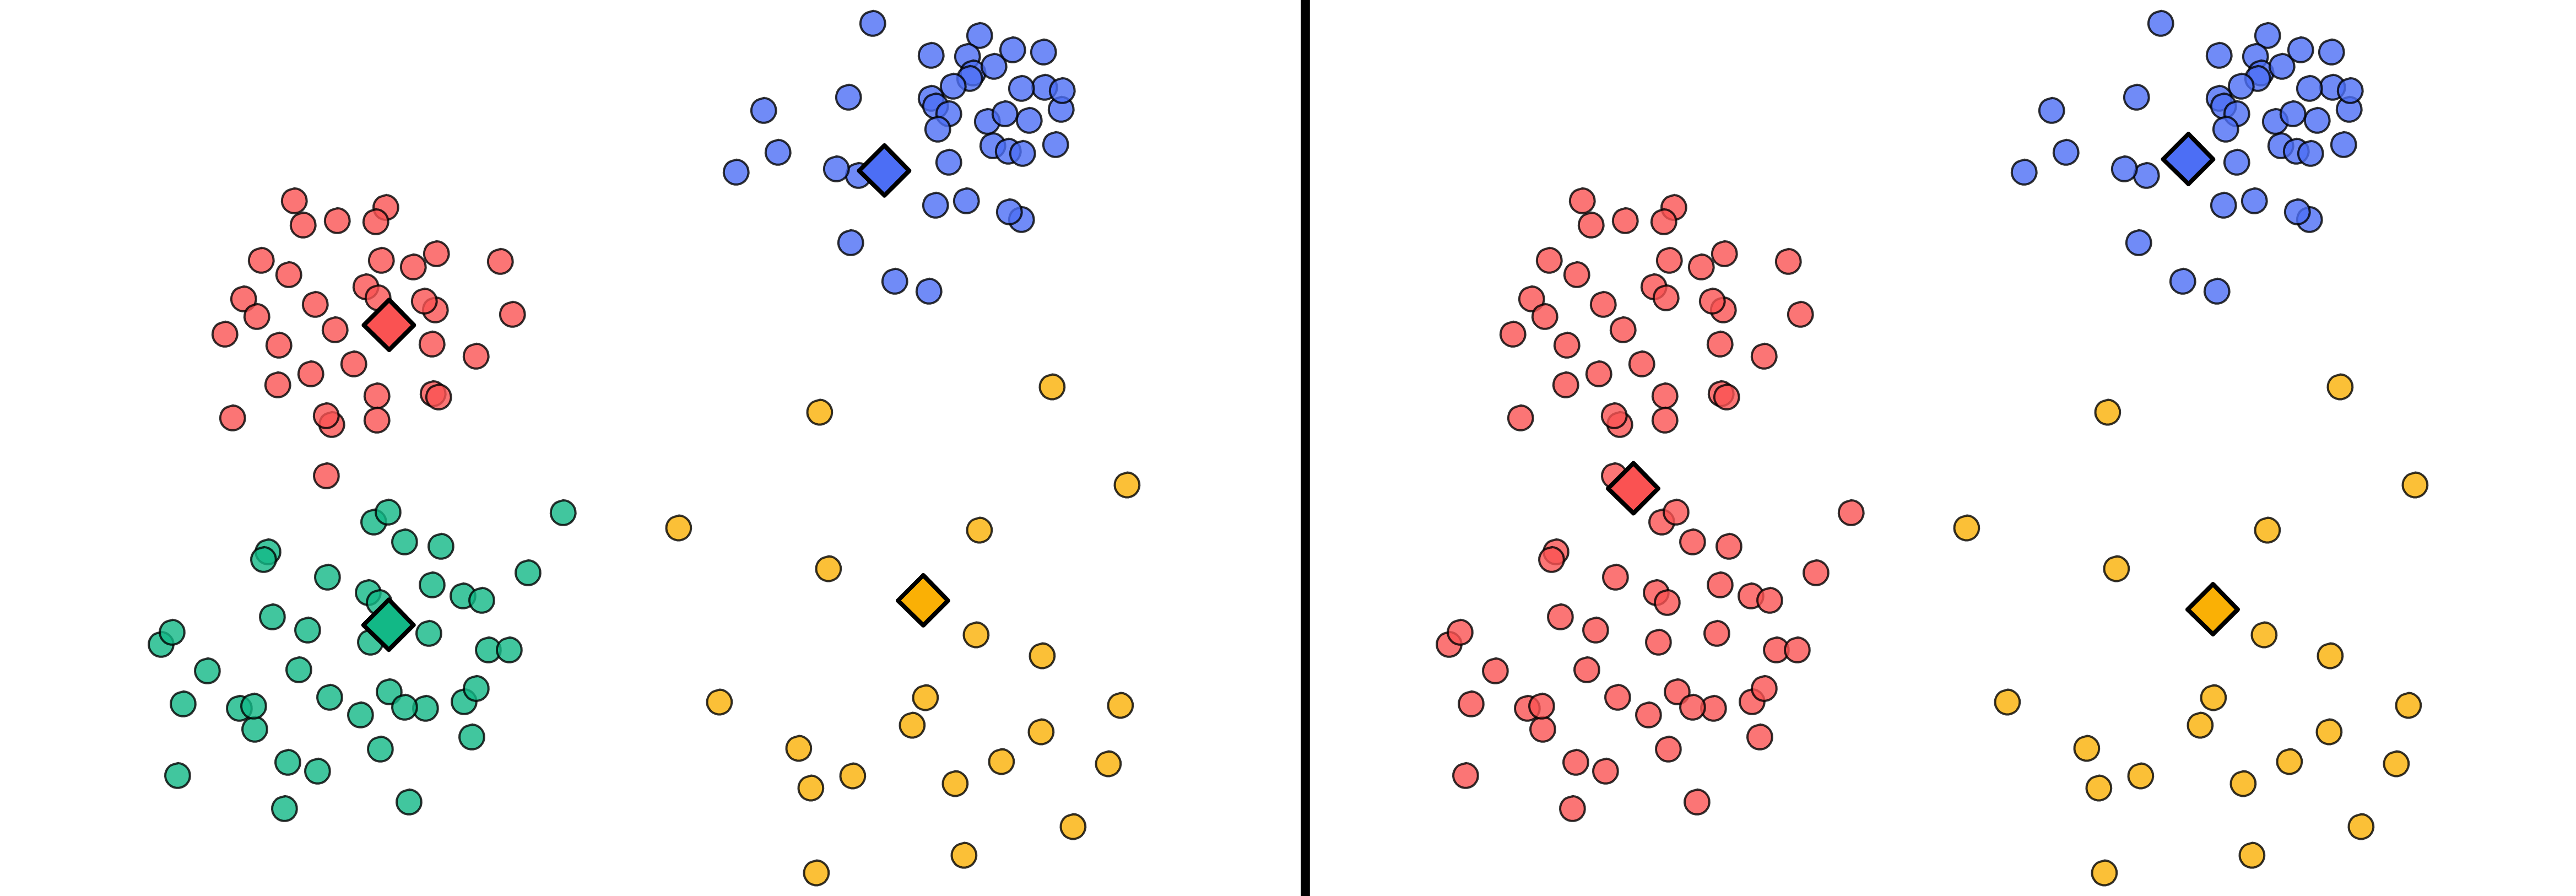
To find the optimal location of these centroids, the AI uses an iterative process. First, the AI puts all potential centroids at random locations. Second, it assigns all points the label of the closest (random) centroid. Third, and now that all points are color coded, the AI updates the cluster’s center of mass (i.e. centroids) according to this new color labeling. Even though the centroids were initially positioned randomly, through many iterations of relabeling and recomputing the centre, the AI slowly finds a stable location of all centroids where all points within a cluster are as close to each other as possible, while being as far away from the other clusters as possible.
As you can see in the figure above, depending on the number of centroids, the AI creates different solutions. And depending on the task at hand you might prefer one solution over the other.
Density-based clustering
Another way to identify if points belong to a common group is by looking at the density between points. At places where the points are sufficiently close together – or in other words where the density is high – they probably also belong to the same group.
The main thing the AI needs to perform the clustering according to the points’ density is the data and a minimum density value at which points are still considered to be dense, i.e. to be in the same cluster. Clustering the gray dots with such a density-based clustering approach could lead to something like this:
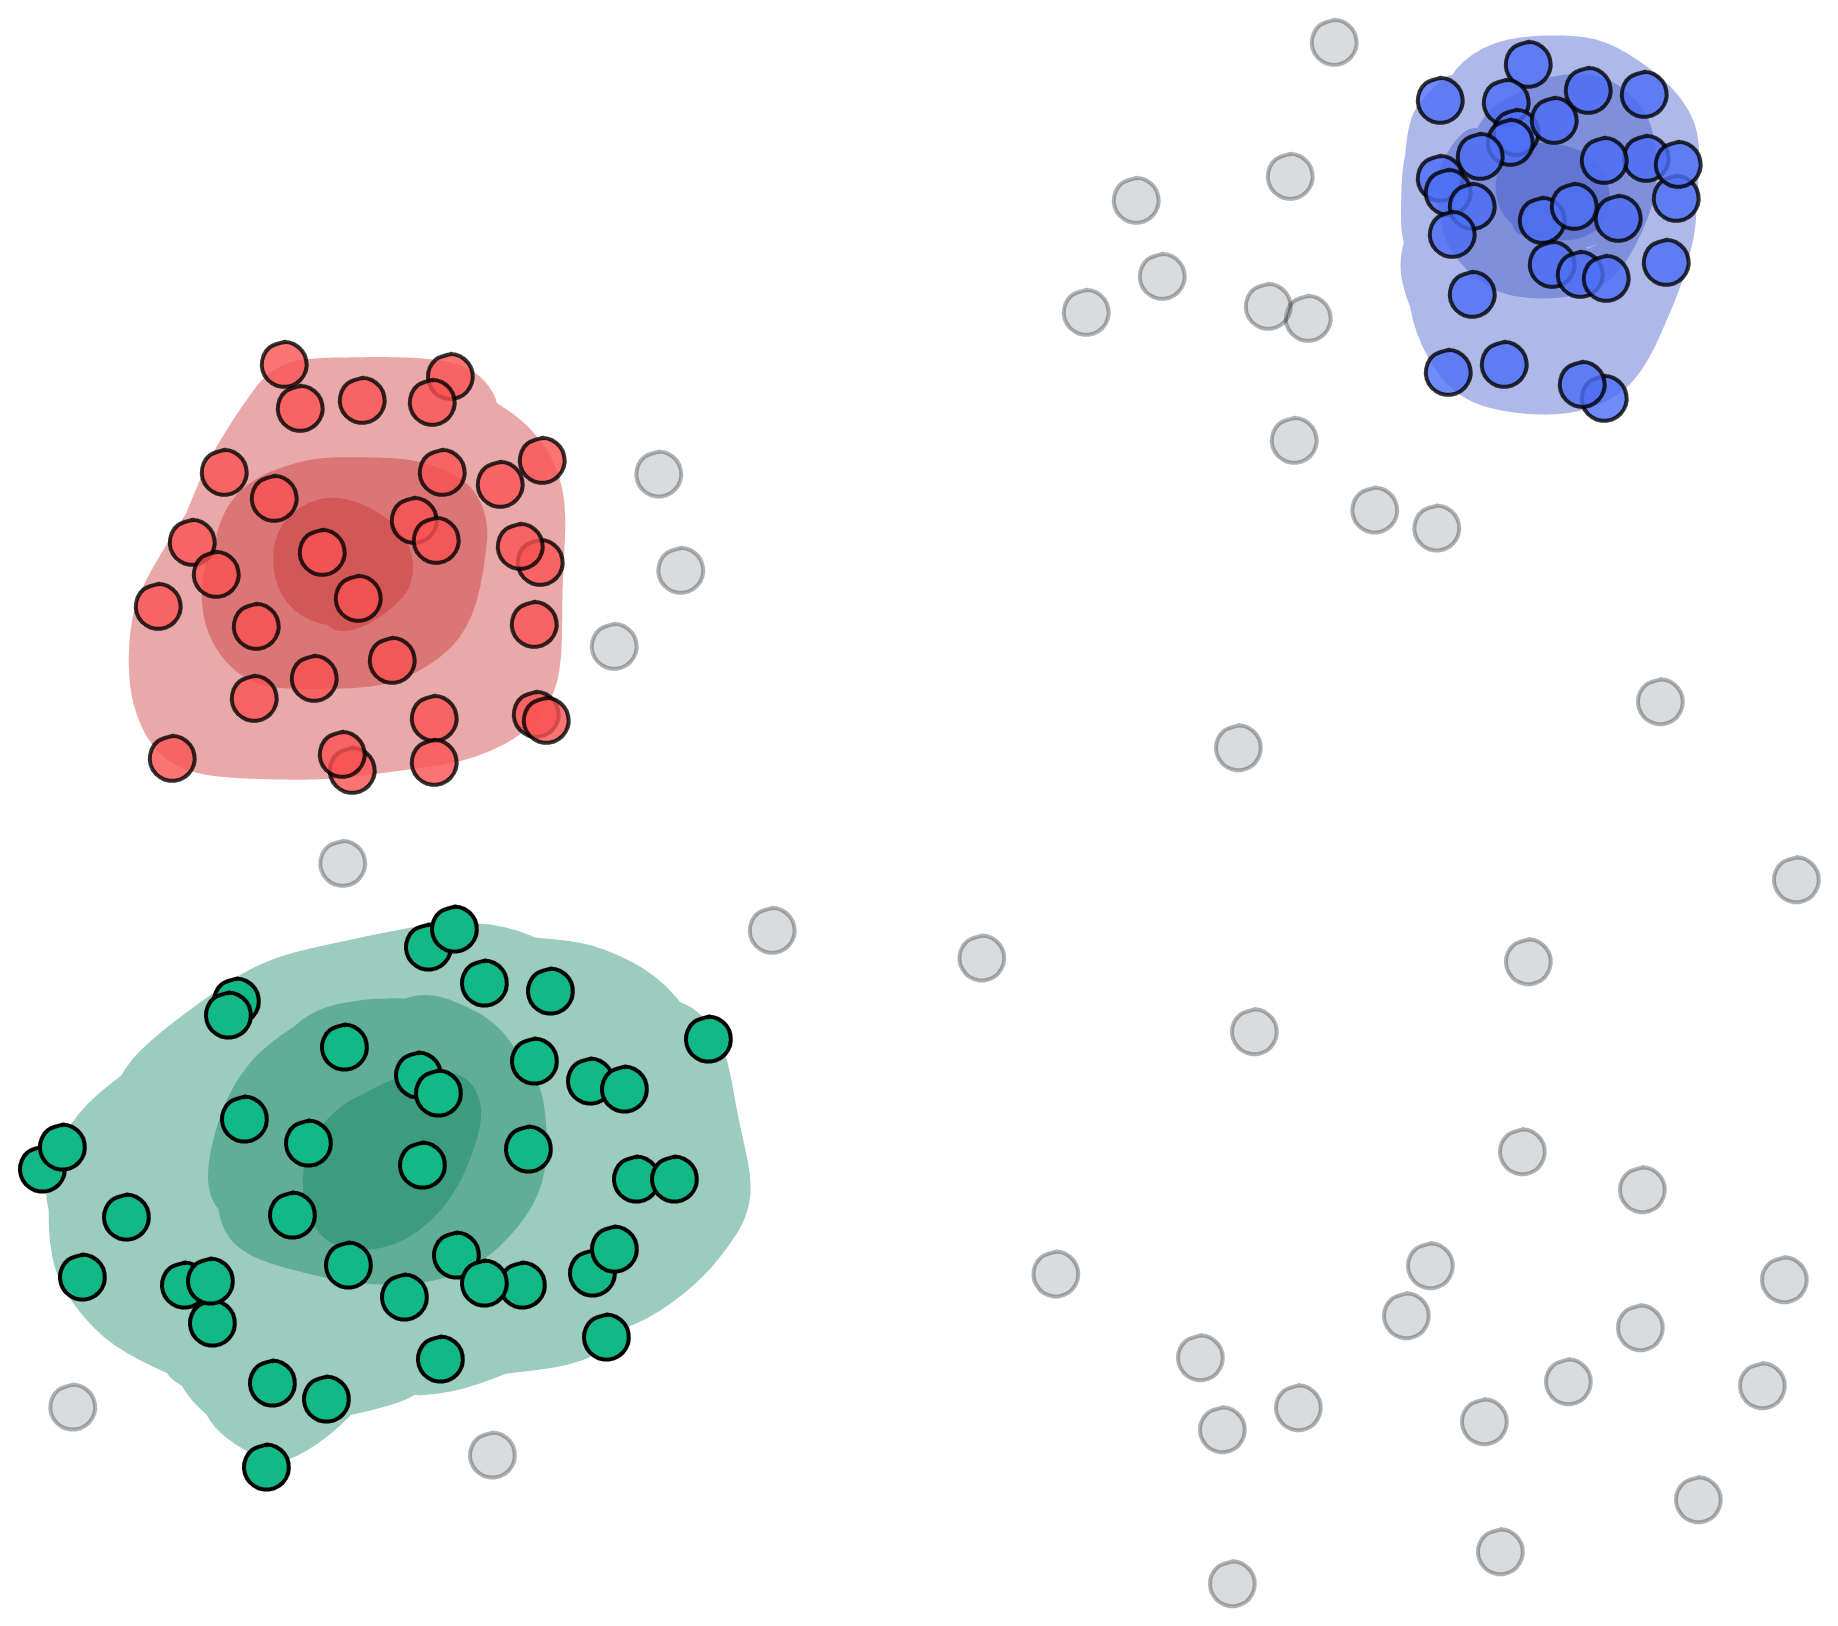
In this example, we highlighted the cluster density in different colors to show where the points might be dense enough together to justify the creation of a cluster. To do this, the AI computes the point density for each individual point and groups all points together that belong to the same dense point cloud. However, the moment the density between two points drops below a certain value, the point will be separated from the cluster. So what we eventually end up with is a label for each cluster where the points are clustered together densely enough.
Although, as you probably have noticed, there are multiple points that didn’t make the cut and weren’t assigned to any cluster. This is because they are not surrounded densely enough by other points. This is the advantage of the density clustering approach. These models dare to leave some far away points, so-called outliers, on the side and assign them as anomalies.
Connectivity-based clustering (hierarchical clustering)
Yet another way an AI can cluster points together is by looking at how close individual points are to each other. While this approach was the inspiration for the previously mentioned density approach, instead of looking at local density, this approach looks at how well points can ‘link to each other’.
There are multiple ways in which the ‘linking’ between points can be computed, but what they all have in common is that they investigate the connectivity between the points – hence the name connectivity-based clustering.
As in a social network, it’s very likely that your friends also know each other, i.e. you are connected to them, but they are too amongst themselves. And while you might not know somebody who knows Roger Federer, it’s very likely that a friend of a friend of a friend might know him. So, eventually, everybody is somehow connected to everybody else. Some connections might be very close (e.g. within your family), while on other occasions they might be very far away (e.g. your pen pal from primary school who now lives in New Zealand).
There are multiple ways an AI can compute the linkage between points. But once they are established, the AI can use this information to identify clusters i.e. points that are highly connected between others in contrast to the other points. Looking again at the previous example, it could look something like this:
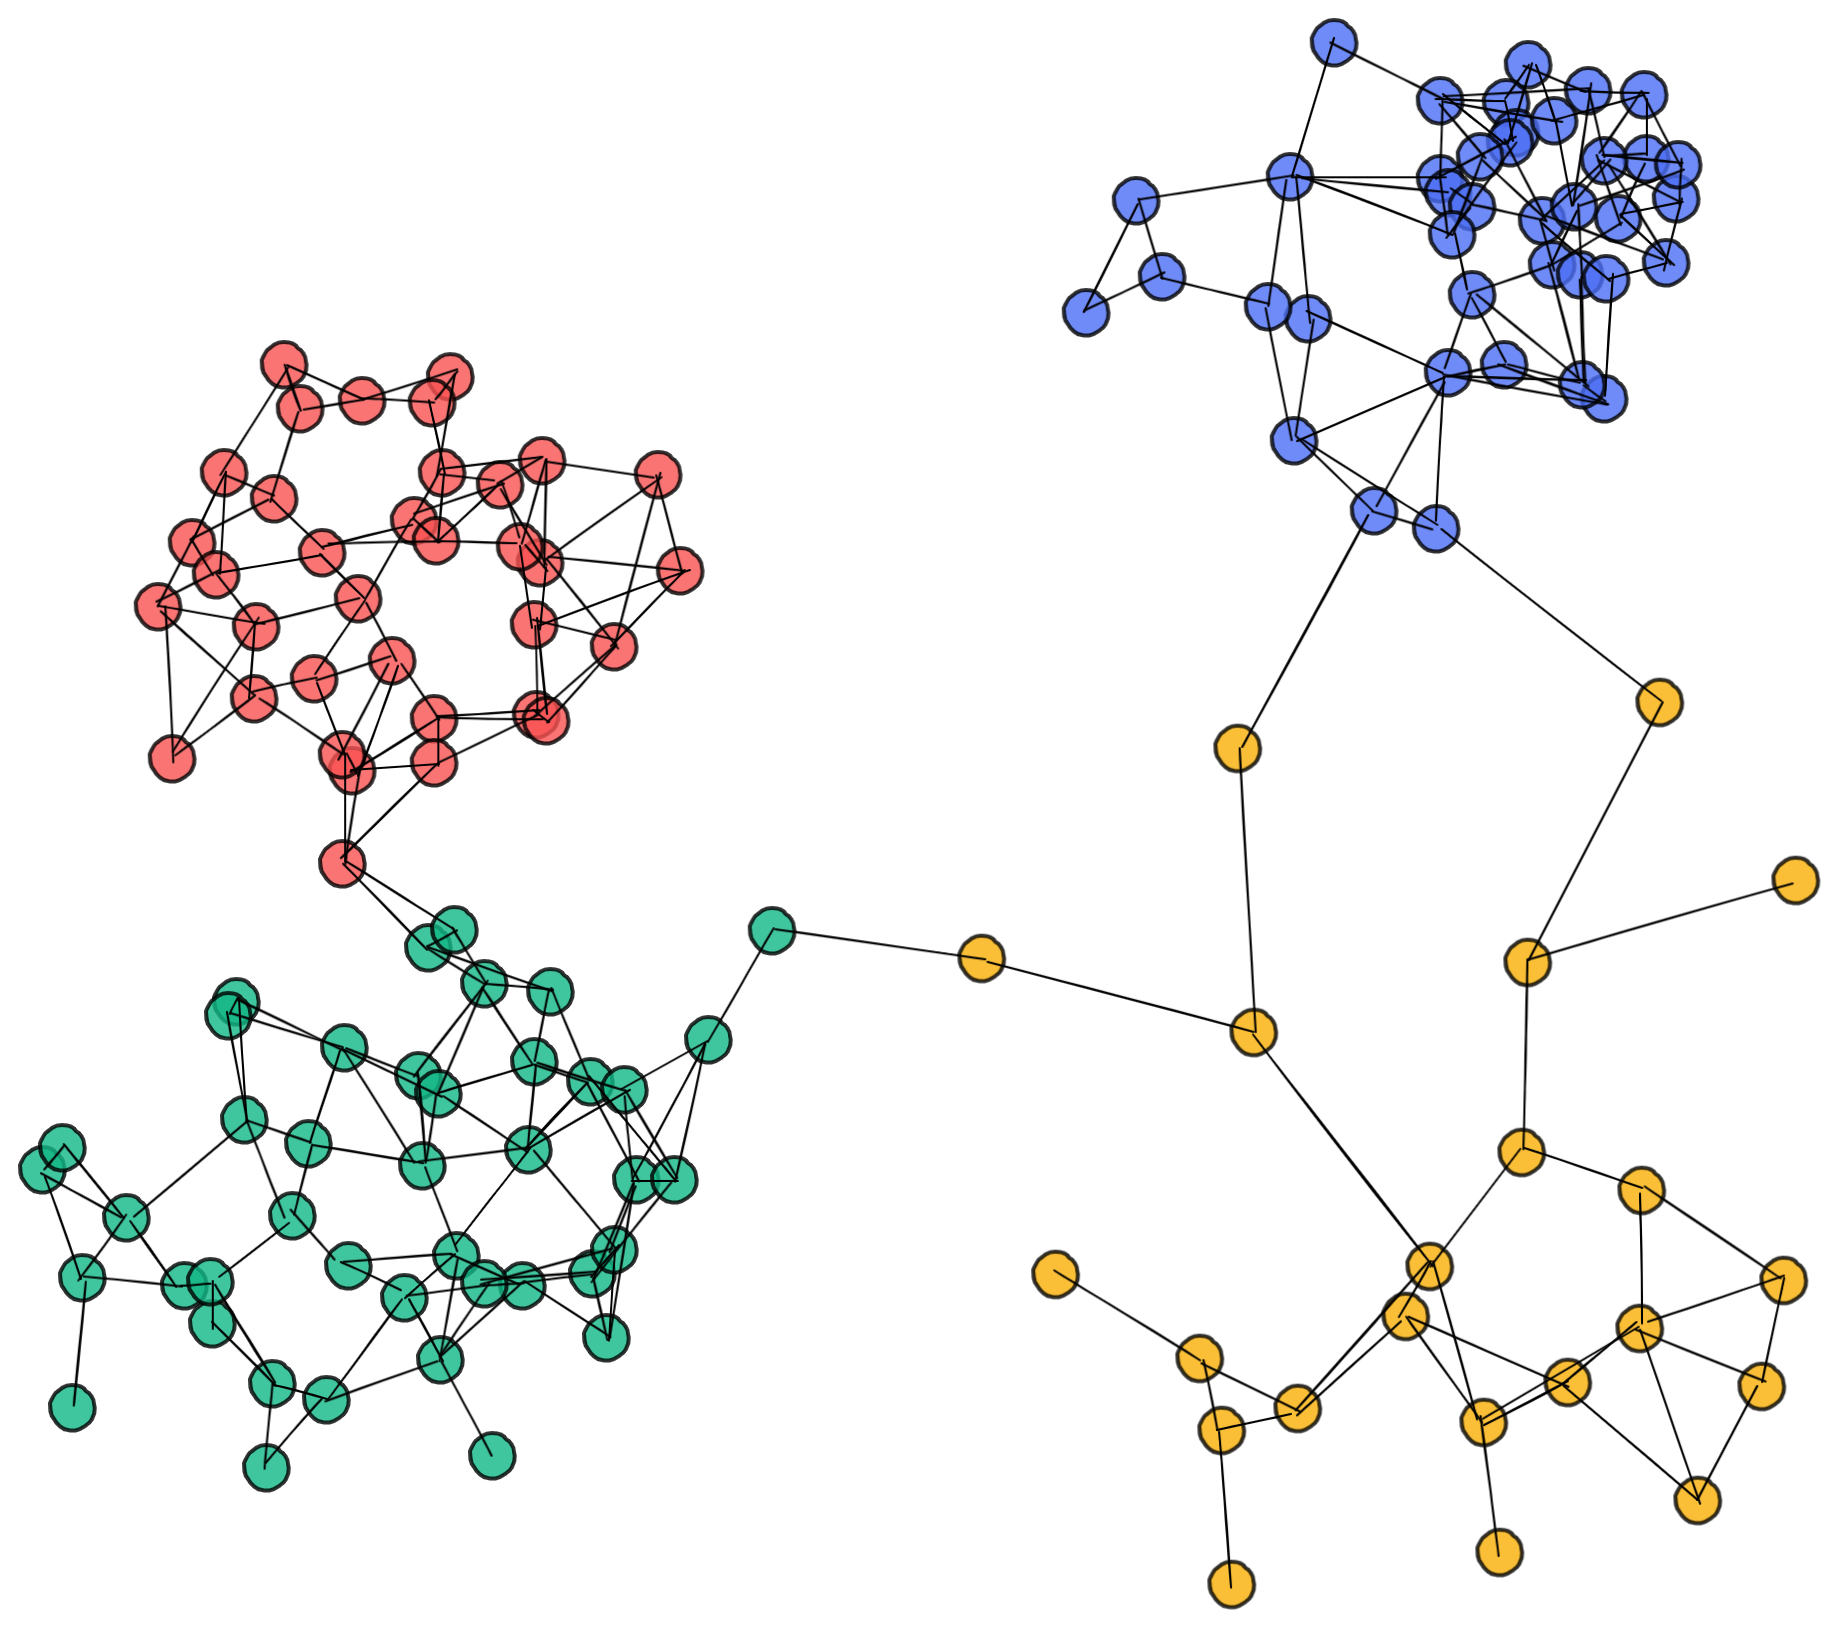
As you can see, points that are highly connected to each other are grouped into the same clusters.1 But in contrast to the other two approaches, every cluster is somehow connected to each other, and every point has at least one connection – even if it’s very far away.
This property gives the connectivity-based clustering approach an advantage over the other approaches. Whereas in the centroid-based approach we need to specify how many clusters we want to look for, in a connectivity approach we can look at multiple cluster-forming thresholds at once. In other words, we can create a hierarchical model of how clusters would merge if we change the threshold for the linkage criteria.
This can be represented by something called a dendrogram:
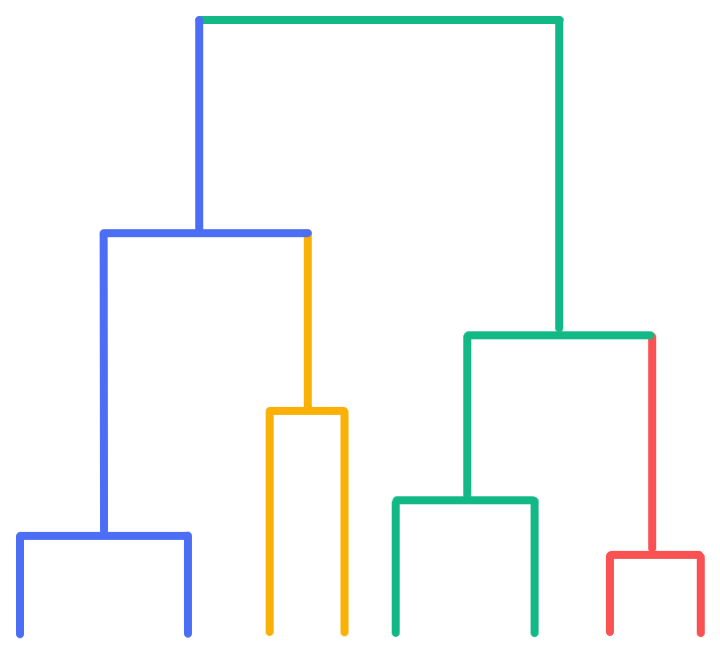
In this (artificial) dendrogram, you can see that the red cluster would be merged into the green cluster, the yellow into the blue, and at the end everything would be merged into the green cluster.
Having such hierarchical information about the clusters can be very useful and provide a lot of insights. However, such a connectivity approach also has disadvantages, especially with regards to outliers. As each and every point is somehow connected to the rest of the dataset, outliers can potentially become the single linkage between two very clearly separated clusters and therefore distort the investigation.
Furthermore, calculating the connectivities between all points and computing the different hierarchical levels at which clusters merge is computationally very demanding – which makes this approach extremely slow for big datasets.
Summary
In this article we learned three different ways an AI can group points in a dataset into separate clusters: centroid, density and connectivity-based. While they all differ in the way they perform the grouping, all of them try to create groups of points where the points within a cluster are as similar to each other as possible, and as distinct from the points in another cluster as possible.
-
What the AI actually tries to optimize is the maximum connection distance between points, meaning that a cluster is defined as the number of points that have the smallest distances to be connected. ↩